How to update/correct HCM records which were created from UI (Manual Entry)?
Can we use Source Keys for the same ?
In thsi post we will try to find answers to the above questions. For this we would need to perform the below steps
Create a Worker Record From Application (Manually using UI)
Fetch the relevant keys namely GUID, SourceSystemOwner and SourceSystemID using BI query
Try to update (correction mode) to the Worker Record (DateofBirth field for this example) using GUID approach and verify results
Try to update (correction mode) to the Worker Record (DateofBirth field for this example) using SourceKey approach and verify results
So without much ado let’s begin.
Creating Worker Record From Application UI
As a first step we would login to the Oracle Fusion HCM Cloud Application with an user having appropriate privilege and navigate to (Navigator -> My Workforce -> New Person). We would populate the required details and submit the request (as shown in sceenshot below)
Image may be NSFW. Clik here to view.
We could see that the Person Number 5006 is generated once the request is submitted.
A quick look at the Personal Details of the worker record reveals that the Date of Birth is 4/12/1998
Image may be NSFW. Clik here to view.
Fetch Relevant Keys using BI Query
In this step we wil run a BI query to fetch the revelant keys. The BI query used is mentioned in the below table
SQL Query used to fetch HDL Keys
select * from HRC_INTEGRATION_KEY_MAP
where object_name = 'Person'
and surrogate_id =
(
select person_id
from per_all_people_f papf
where trunc(sysdate) between papf.effective_start_date and papf.effective_end_date
and papf.person_number = '5006'
)
The BI Data model would appear as below:
Image may be NSFW. Clik here to view.
And the data retrieved is as below:
Image may be NSFW. Clik here to view.
GUID Approach
In this approach we will use the GUID to make corrections to the Worker Record. For this example we will make changes to the Date of Birth field where we will change the current value of 4/12/1998 to a new value of 12/10/1995. The data file will look as below:
Image may be NSFW. Clik here to view.
When we verify the load from application using “Import and Load” the load is successful
Image may be NSFW. Clik here to view.
A quick verification on the application UI confirms that the changes have been records in the system
Image may be NSFW. Clik here to view.
SourceKey Approach
In this approach we will use Source Keys (Source System Owner and Source System ID) and will try to
Change the Date of Birth value from 12/10/1995 to 7/12/1994
The data file would look as below:
Image may be NSFW. Clik here to view.
The “Import and Load” page shows the load is successful
Image may be NSFW. Clik here to view.
And a quick look at the Application UI (Manage Person shows that the Date of Birth field has got
Changed to the new value)
Image may be NSFW. Clik here to view.
Summary
From the above we can clearly summarized that we can use either of Source Keys or GUID to make
Changes to records created via UI. The important point to note however is to that one needs to fetch the
GUID value and Source System ID value . The Source System Key for all records created via UI is
One of the most common requirements for any organization using an HCM ERP System is to find the number of pending transactions at any point of time. All of us live in a busy world where everyone has to don multiple responsibilities at same time. Imagine if there are multiple transactions like Add Employment, Change Salary, Change Location, Leave Approval and many other such ESS transactions which needs Manager Approval and the supervisors/managers are pre-occupied with other priority tasks. Chances are that in such situation the HCM Transaction wither remains in PENDING stated or goes into ERROR. One may use the Worklist Notifications View available in the UI but having a custom report which gives a consolidated view of all pending transactions really helps.
Such a report can be created wither using OTBI or even BI Report too (Not sure if there is an available UE for the same using which HCM Extracts can be created too, but in this article we will restrict ourselves to the OTBI and BI part only).
Until Release 11 creating such a Report was not possible as there was no Subject Area available. But starting release 12 we have “Human Capital Management – Approval Notification Archive Real Time” which allows us to get an insight into HCM Transaction data.
One perquisite prior to creating an analysis based on “Human Capital Management – Approval Notification Archive Real Time” subject area is that one should run “Archive Workflow Tasks” ESS Job which is only available post Release 12 PB8 onwards.
Image may be NSFW. Clik here to view.
Once you run the above mentioned ESS Job you can get started with creating a OTBI Analysis.
For this example, we have selected 5 columns as below:
Attribute Name
Data Source
Business Process Name
"Approval Notification Details"."Process Name"
Task Status
"Approval Notification Details"."Task Status"
Subject
"Approval Notification Details"."Task Title"
Status
"Approval Notification History Details"."Status"
Stage
"Approval Notification History Details"."Stage"
Image may be NSFW. Clik here to view.
A quick look at the results tab shows the output data:
Image may be NSFW. Clik here to view.
The Analysis XML which gets created as a result is mentioned below:
<sawx:expr xsi:type="sawx:sqlExpression">"Approval Notification History Details"."Stage"</sawx:expr></saw:columnFormula></saw:column></saw:columns></saw:criteria>
For most of the consultants who have been working with legacy ERP Applications like EBS, Peoplesoft one common requirement have been to send Flat Files (either in CSV, Pipe Delimited or EFT files) to third party systems for further processing. While generating such files using an on-premise system was not a big deal (availiblity of SQL , PL/SQL) it could be a challenge to generate the same in an Oracle HCM Cloud. I know many a times some generate raw data (XML format) from HCM Extract and use some of the middleware tools (Boomi,Mulesoft..etc) to get flat files from there. While I dont say that it does not has his own set of advantages and disadvantages but the same can be achieved in Oracle HCM Cloud Application too by making use of EText Template.
We would see how we do this in this example.
For the same we would perform the following steps:
Create a simple custom extract
Create a EText Template and associate it with the custom report attached to Extract (Delivery Options)
Verify Results
So withour further delay let;s get started
Create a simple custom extract
We would create a simple HCM Extract which would comprise of First Name, Last Name, Employee Number, Email-id, Organization Name and other fields. We will call this extract as ETextExtract.
The Extract components are as follows
Image may be NSFW. Clik here to view.
And we also need to check that the Extract status is valid ( from Extract Execution Tree )
Image may be NSFW. Clik here to view.
Creating EText Template
We would need to create an EText Template too for the same. The EText Template ( we name it as New_Joiner_EText.rtf) will have a header part and one one data part.
The Header part will appear as below:
Image may be NSFW. Clik here to view.
And the Data part as shown in screenshot below:
Image may be NSFW. Clik here to view.
Verifying Results
Now that we have all the components in place we will run the extract and verify the results.
Image may be NSFW. Clik here to view.
And once we click on View Results (highlighted in yellow in above screenshot) we will see all available output files
Image may be NSFW. Clik here to view.
And the output file will be as below:
Image may be NSFW. Clik here to view.
The Extract Definition File and EText Template can be downloaded from below link:
Making a smart combination of the above two concepts one can very well create a Self Service Report from a link too. The same feature can be very well demonstrated if one has a close look into the delivered “My CV” Report.
Some of the salient features of this Report (“My CV”) are:
Its available as a menu item on About Me so a simple click shows you the Report Output on the screen (pdf format)
The Report has various parameter options basis which one can pick choose which all sections of the CV is one interested to view ( the default setup shows all fields)
Provides a complete detail of an individual ( like a curriculum vitae).
So without further ado let’s try to run the report and verify results.
Running the Report
As a first step we need to login with an user (LINDA.SWIFT for this example) and click on the About Me This opens up a lot of other smaller icons and one of them is My CV
Image may be NSFW. Clik here to view.
Once we click on My CV it shows us all the details in PDF format
Image may be NSFW. Clik here to view.
We should notice that by default the values of all the parameters is set to ‘Y’ which means we want to have all the details displayed be it (Learning History, Memberships,Special Projects, Languages,Accomplishments or Education Levels) but one can choose to set values to ‘N’ and then only the General Info section would be displayed and details of all other sections would be Blank (only the headers would be displayed)
User Experience is one among the many areas where significant improvements have been made. Oracle continues to enrich your user experience in this release with a contemporary home page design and layout, a new and modern theme and a new icon style to go with it. The global header has got a facelift where its icons render in the new Outline style and there is less clutter. You can now find the Show Help and Access Accessibility Settings in the Settings and Actions menu. Using the Set Help Options task in the Setup and Maintenance work area, administrators can enable the help icons to appear by default on all pages where they are available.
The Navigator is also simplified and page entries for work areas such as Sandboxes, Migration, Appearance, Structure, User Interface Text, Business Objects, Application Composer, and Page Integration are moved from the Tools group to a new group called Configuration. Page entries for standalone work areas, such as Getting Started, Social, My Dashboard, Marketplace, and Setup and Maintenance, are part of a new Others group.
The Navigator is also enhanced to reflect the contemporary look of the News Feed home page layout. Its content is displayed to provide a top level group or cluster view for easy navigation or an expanded list view. You can use Show More and Show Less to toggle between these views. The new Outline icon type provides a modern look to the icons, which complements the news feed layout. Image below
Image may be NSFW. Clik here to view.
Newsfeed Home Page Layout
A new default home page layout called News Feed is introduced in this release. Administrators can now set the default home page layout to any of the following:
Panel
Banner
News Feed
The News Feed home page layout leads the industry trends by offering a content rich, yet simple to use interface that presents enterprise information in a news feed layout to help you make informed decisions and take quick actions. When set, this home page mainly contains the Apps section and a series of updates with important information that you can view at a glance, such as Things to Finish, News and Announcements, and Analytics. You can also use a list of quick actions, if available, to quickly perform some key tasks. With this layout, your home page provides easy navigation that is consistent across various devices such as desktop, tablet, and smartphone.
In one of the previous article (Using Delivered Date Time and System Functions in OBI Analysis) we have seen how to use delivered functions to display Current Date, Current Time, Logged In User and other details. Continuing with the same we will try to show how can one use SUBSTRING function in an OTBI Analysis.
So let’s get started.
Using Substring Function in OTBI Analysis
In order to demonstrate this we would create a very simple OTBI Analysis. For this example we would use “Workforce Management - Person Real Time” Subject Area and the details of the field included are present in table below.
Attribute Name
Attribute Value
Person Number
"Person Details"."Person Number"
National Identifier Type
"Person National Identifiers"."National Identifier Type"
National ID
"Person National Identifiers"."National Identifier Number"
First 3 Characters of NID
SUBSTRING("Person National Identifiers"."National Identifier Number" FROM 1 FOR 3)
4th and 5th Character of NID
SUBSTRING("Person National Identifiers"."National Identifier Number" FROM 5 FOR 2)
Last 4 Characters of NID
SUBSTRING("Person National Identifiers"."National Identifier Number" FROM 8 FOR 4)
The Crieteria Tab would appear as below:
Image may be NSFW. Clik here to view.
And the results tab would show the desired results
This course is appropriate for all members of the implementation team and is intended to give students a broad understanding of Oracle Communications Billing and Revenue Management and its capabilities. Students will be exposed to a high-level view of the systems real-time and high-performance batch architecture. The BRM Functional Overview class will also introduce students to the Revenue Management Lifecycle as students create test accounts and perform basic maintenance tasks using the client tools in support of the lifecycle. By completing this course, students will learn the tools and procedures used to accomplish tasks such as creating and managing customer accounts, billing customer accounts, managing accounts receivables, managing payments, creating and manage pricing objects, and managing the revenue associated with customer accounts. Students will accomplish this through demonstrations and hands-on labs.
One of the basic challenege every Oracle HCM Cloud Integration Consultant must have faced till date is to find the correct HDL keys required to update/correct records. Some of the commonly known ways via which the same is retrieved being:
Referring Intital Data Load File
This is probably the most authentic and sure shot way of fetching HDL keys for data loaded via HDL. But it comes with some shortcomings like one would not keep the file saved securely and not all the records may be present in one file (there could be multiple files used and storing all of them can be a herculian task)
Use BIP Queries to fetch HDL Keys
One may even use BIP Queries to fetch the HDL keys. There are integration tables which holds columns like Source System Owner, Source System ID, Surrogate ID and GUID along with object name.
Using Business Object Key Map Extract
One may run the delivered Business Object Key Map Extract and fetch the values
However, in this example we will try to use another delivered extract “Integration Object User Key Map Extract”.
The various steps involved are:
Create a copy of Integration Object User Key Map Extract (say “XX Integration Object User Key Map Extract”). Compile the Fast Formula and add a Delivery Option.
Run the Extract
Check Results
So without further ado let’s get started.
Creating a Copy of Integration Object User Key Map Extract
We would navigate to Data Exchange -> Manage Extract Definitions-> Choose Integration Object User Key Map Extract and click on copy icon on top left hnd side .
We would be asked to give a new Name to the extract after which we would need to compile the associated fast formulas and ensure that the extract definition is valid.
Image may be NSFW. Clik here to view.
Running the Extract
Now that we have the extract ready we will run the extract. We will pass “Worker” as the object and since we are interested to get the HDL key value for records which were created in Fusion (referred to as Base System) we will pass the same value in parameter
Image may be NSFW. Clik here to view.
Checking Results
Once the Extract Run is complete we can navigate to the “Extract Delivery Options” and download the XML Data.
Image may be NSFW. Clik here to view.
And post download when we open the XML file we should be able to see the HDL Keys
Topology is the representation of the information system in Oracle Data Integrator and which uses the topology to connect to resources in the information system for integration processes.
It includes everything from data servers and schemas through reserved keywords in languages used by different technologies. ODI uses this topology to access the resources available in the information system to carry out integration tasks.
What Is in the ODI Topology?
All available technologies are defined in the topology. For each technology, the available data types are defined. However, you define all data servers that use the technology in your information system. For each data server, you then define the subdivisions that are known as schemas in ODI.
Next, you must define the agents that carry out the integration tasks at run time. You also set up the contexts that enable you to define an integration process at an abstract logical level, then link it to the physical data servers where it will be performed.
Languages and actions are also found in the topology. Languages specify the keywords that exist for each technology, and actions are used to generate the data definition language (DDL) scripts.
You would only need to modify these parts of the topology if you were adding a new technology to ODI.
Image may be NSFW. Clik here to view.
Data Servers and Physical Schemas
The most essential things to define in your topology are your data servers and physical
schemas. These enable you to connect to your data through ODI.
What Is a Data Server?
The definition of a data server in ODI is fairly broad. A data server may not always be a traditional DBMS. Instead, any system that is capable of storing data and making that data available in the form of tables is a potential data server in ODI. In ODI topology, a data server is always attached to a specific technology, such as Oracle, Oracle Essbase, Sybase, Extensible Markup Language (XML), or Microsoft Access.
Image may be NSFW. Clik here to view.
There are multiple ways of connecting a data server to ODI. Most often, Java Database Connectivity (JDBC) is used. JDBC drivers exist for a wide range of technologies. Java Naming and Directory Interface (JNDI) is another way to connect to your data server through a directory service. Additionally, new technologies can be created that enable connectivity to application-specific data sources such as Oracle’s Hyperion Essbase. Some concrete examples of data servers may be helpful. Each instance of a traditional database engine, such as Oracle or Microsoft SQL Server, is a data server. Thus, if you have two instances that are running on the same machine, ODI considers them to be separate data
servers.
A Hyperion Essbase server instance is also a data server. The ODI physical schema represents an Essbase application, and the database represents the Essbase database (cube). This is an example of an application that is capable of storing data and presenting it in the form of tables.
There are a number of simple guidelines to remember when setting up your topology in ODI.
Guideline 1 and Recommendations is that every data server in your information system should appear once in your topology. For example, if you have a machine running two instances of Oracle and one Paradox data source, you have three physical data servers.
Image may be NSFW. Clik here to view.
Guideline 2 and Recommendations
For each data server in your topology, you must define a physical schema to represent each subdivision of the server that will be used. So, if a server has four technology-specific subdivisions, but you want to use only two in ODI, you must define two physical schemas for that server.
What Is a Physical Schema?
A physical schema is a subdivision of a data server whose precise definition depends on the technology involved. Physical schemas indicate the physical location of the datastores, such as tables, files, topics, and queues inside a data server. The names of physical schemas are used to prefix object names when generating code to produce their qualified names. The physical schemas that need to be accessed have to be defined under their corresponding data servers. You will now see some examples of how this works on different technologies
Physical Schemas: Properties
An ODI physical schema comprises two separate data server schemas: A data schema where the datastores for the physical schema are located and a work schema that is used by ODI to store temporary objects during integration processing. Several physical schemas can share the same work schema.
A data server schema in a data server is uniquely identified, depending on the technology, by a catalog name or a schema name, or both. The terms for the catalog name and the schema name differ depending on the technology.
For example, in Microsoft SQL Server, the catalog is called “database,” and the schema is
called the “owner.”
In Oracle, there is no catalog and a schema is called a “schema” or “user.” You will see some
examples later in this lesson.
Though a data server can have several physical schemas, it has one default physical schema that is used to select a work schema to store server-level temporary objects during certain integration processes.
Defining Topology: Example
The most essential things to define in your topology are your data servers and physical schemas. These enable you to connect to your data through ODI.
Image may be NSFW. Clik here to view.
Example: Infrastructure for Two Production Sites
Here is an example that you will refer to throughout this lesson. It is a simple setup with accounting and sales information that is used to populate a data warehouse and a purchasing database.
There are two separate production sites, with the first based in London. The London production site has a Windows machine that runs SQL Server. The data warehouse for London is hosted on this machine. The SQL Server database is named db_dwh at this site and the London purchasing database, also hosted on this machine, is named db_purchase.
The example also shows a Linux machine, which, for historical reasons, has two different versions of Oracle running on the same system. One version has a schema for accounting, and the other version has a schema for sales.
A second production site is in New York. Here, the data warehouse and purchasing databases are split onto different Windows machines that run SQL Server. The data servers are labeled “MS SQL Server A” and “MS SQL Server B.” However, the accounting and sales databases run on a single Oracle server. Note that the physical schemas at this site have different names from those at the London site.
ODI Design: Physical Architecture of the Two Production Sites
Applying the previous architecture in ODI design, guidelines 1 and 2 enable you to design this physical architecture in ODI. You disregard which machines physically run which servers.
Each Oracle and SQL Server instance is represented as a data server in the ODI topology.
Similarly, each Oracle schema or SQL Server database is represented as a physical schema
Image may be NSFW. Clik here to view.
Logical Schemas and Contexts
You learned about the physical architecture, which describes how ODI physically accesses data. Now, you look at the logical architecture, which is a more general view that takes into account the similarities between the physical schemas in different environments.
Image may be NSFW. Clik here to view.
What Is a Logical Schema?
The essential concept to understand in the logical architecture is the logical schema. A logical schema is a single alias for different physical schemas. These schemas should have similar or identical data structures, and must be based on the same technology. The logical schema thus brings together different physical schemas representing the same kind of data in different contexts.
If two similar data schemas are stored in two different data servers, but they have the same data structures, you declare the two data schemas as physical schemas in ODI, according to guideline 2. However, you create a single logical schema that represents the pair of schemas. The context determines the physical schema that will be used at any given time.
A good example of a logical schema is found in the information system example. In London, the accounting database is stored in a schema called ACCOUNTING. In New York, the schema is called ACCT. Both of them have the same data structure; they contain all tables for an accounting application. In the ODI topology, you consider them as one logical schema: Accounting.
Important Guideline 3
You should define one logical schema each time that you have a group of physical schemas containing similar data structures. In this example, Accounting represents the ACCOUNTING Oracle schema on the Windows machine in New York, the ACCOUNTING schema on the Oracle 10g server running on Linux in London, and the ACCT schema running on Linux in New York.
Note: A simple way to understand guideline 3 is to remember that one logical schema corresponds to the data structure for one application, implemented in several places called physical schemas.
Logical Versus Physical Architecture
This distinction can be generalized into the logical architecture as distinct from the physical architecture.
The physical architecture tells ODI about physical resources, such as connections to data servers and agents that will be covered later in the lesson. The physical architecture describes the locations of servers that exist in your information system and the schemas that you want to use on them. For example, you may logically have one data schema representing your accounting application. But, if this schema exists in different places, you should declare these as separate physical schemas.
The logical architecture, on the other hand, gives a more abstract view of these resources. In this example, your accounting application schema is defined only once in the logical architecture. It is a single schema implemented in several different contexts.
What Is a Context?
A context represents a “situation” where you see the same group of resources. From a technical perspective, a context maps individual logical resources onto individual physical resources. So, given a context and a logical resource, ODI can determine the unique physical resource that is appropriate. In terms of topology, the logical architecture is mapped onto the physical architecture through a context. In your example, London, New York, and Development are contexts representing different geographical sites. However, it can also represent situations for different purposes, such as development, test, or production sites.
A Context Maps a Logical to a Physical Schema
A logical schema can have multiple physical schemas resolved per context. In this example, for the Development context, the ORACLE_ORCL_LOCAL_SALES logical schema maps to the
ORACLE_ORCL_LOCAL.SALES_DEV physical schema
Image may be NSFW. Clik here to view.
Defining Contexts
Guideline 4: If you have similar groups of resources in different situations, you should define one context for each situation.
If you apply guideline 4 to the example, each site clearly represents the same collection of four different resources. Therefore, you have three contexts: Development, London, and New York.
Dev Site: MumbaiProd Site: London
Image may be NSFW. Clik here to view.
Production Site: New York
Image may be NSFW. Clik here to view.
Mapping Logical and Physical Resources
You now illustrate the meaning of a context graphically by using the infrastructure example.
You know about the data warehouses in New York, New York, and London that have different names but share similar data structures. At the logical architecture level, you have a single logical schema called Data warehouse. However, you have three contexts. In the “Development” context, this logical schema is mapped onto the physical schema db_dwh at the New York site. In the “New York” context, it is mapped onto the physical schema dwh at the New York site. In the London context, the logical schema is mapped onto the physical schema db_dwh at the London site.
Image may be NSFW. Clik here to view.
Mapping Logical and Physical Resources (continued)
You may wonder what would happen if you had a large number of logical resources and a large number of contexts. Would you have to map every single logical resource in every context?
The answer is no. You can leave logical resources unmapped in any context. However, when executing an object in that context, unmapped logical resources cannot be reached. In addition, one single physical resource may be useful in several contexts. For example, you may want to retrieve information from the company Web server in various contexts. This does
not pose a problem. You simply map it to a logical resource in each context. There is a restriction regarding contexts and mapping logical and physical resources. In a given context, a logical resource can be mapped to one physical resource at the most. That is, in a certain context, the data warehouse logical schema cannot be mapped to the data warehouses in London and New York simultaneously. This means that when you ask for one logical resource in one context, you will always have
access to one physical resource if the logical resource is mapped in the context.
Image may be NSFW. Clik here to view.
Planning the Topology
To plan your topology:
1. Identify the physical architecture that you have in place. All physical data servers and schemas need to be defined in ODI.
2. Similarly, consider the agents you would need and the machines on which they would be located.
3. Identify the different contexts you have by looking for similar data schemas and agents in different situations.
4. Provide names for those similarities to create a logical architecture. Provide a name for each logical schema and Logical agent.
5. Finally, write a matrix of the mappings from your logical architecture to your physical architecture (Use pen and paper.).
Oracle Apex introduces an features of Interactive Grids that are both editable and read-only allowing a powerful component for a rich user experience.
It includes plenty of capabilities for changing how the data can be displayed and with few new options available in the Actions menu it also has the ability to rearrange the report interactively with a click of a mouse.
How to create the Interactive Grid:
Let’s take a closer look on how to create an interactive grid in Oracle Application Express
Step 1: Log in Oracle Application Express 5.1
Step 2: Click on the Application Builder Icon option
Image may be NSFW. Clik here to view.
Step 3: Select any existing application from the available options OR Create a new Application if there isn’t any.
Step 3.1: If existing application, click on Create Page option
Image may be NSFW. Clik here to view.
Image may be NSFW. Clik here to view.
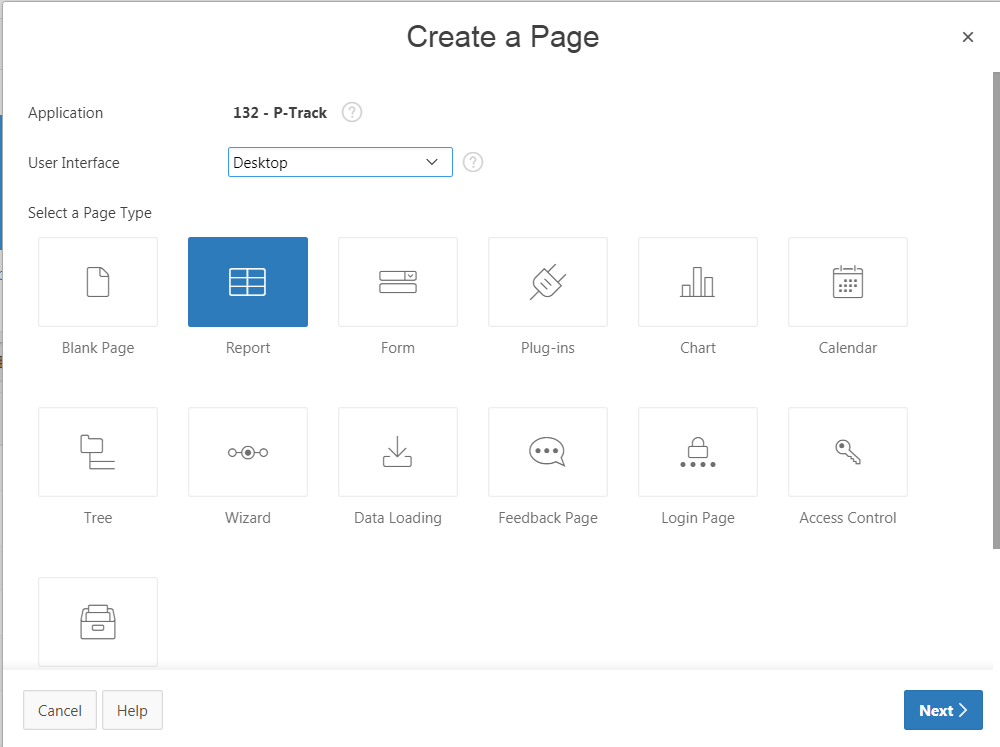
Step 3.1.1: Select Report, Select Interactive Grid, and click Next
Image may be NSFW. Clik here to view.
Image may be NSFW. Clik here to view.
Step 3.1.2: Enter Page Name: Demo IC then click Next
Step 3.1.3: Accept the default, then click Next
Step 3.1.4: Select Table Option, Schema → HR, Table Name → EMPLOYEES, Select all Columns in the Shuttle to the right button followed by Create
Image may be NSFW. Clik here to view.
Step 3.1.5: On the Page, extreme right corner click the Run Icon to run the Page
Image may be NSFW. Clik here to view.
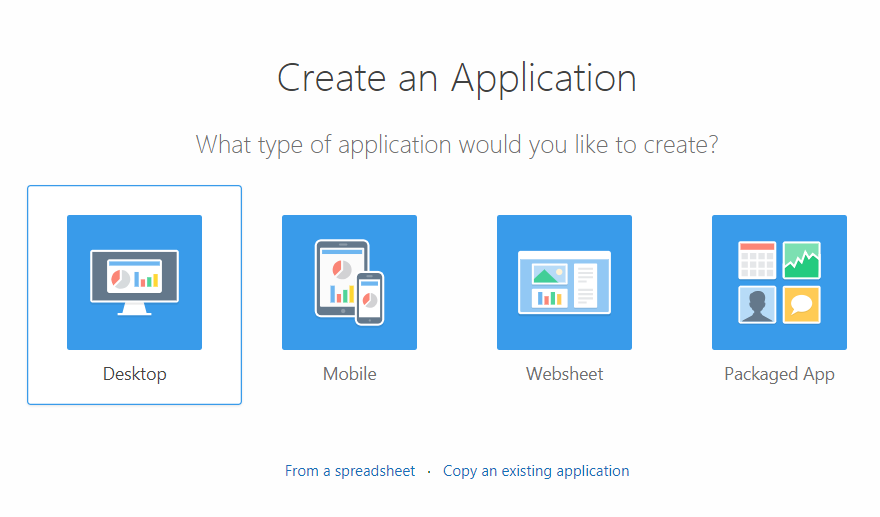
Step 3.2: If no application exists then click Create → Desktop
Image may be NSFW. Clik here to view.
Image may be NSFW. Clik here to view.
Step 3.2.1: Enter Demo IG for Name, and click Next
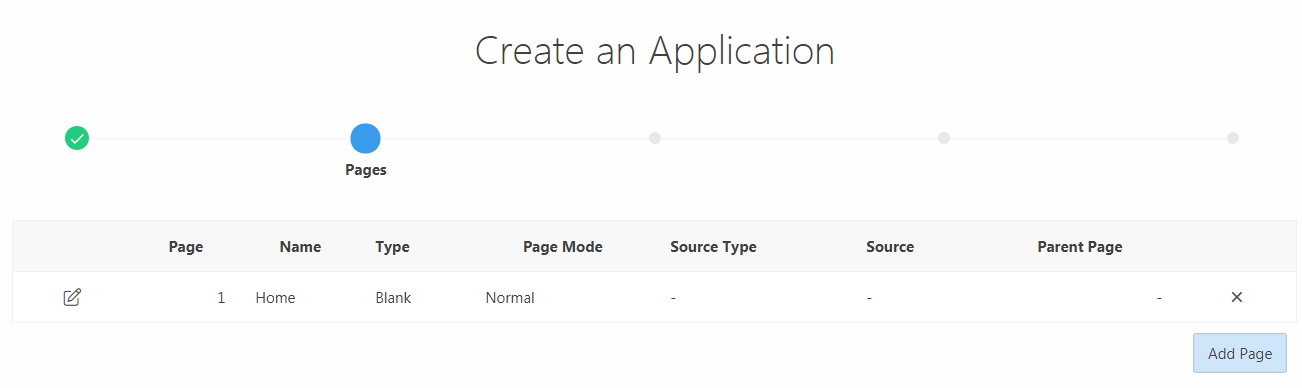
Step 3.2.2: By default, the Home page gets created. To add another page, click Add Page then click Next
Image may be NSFW. Clik here to view.
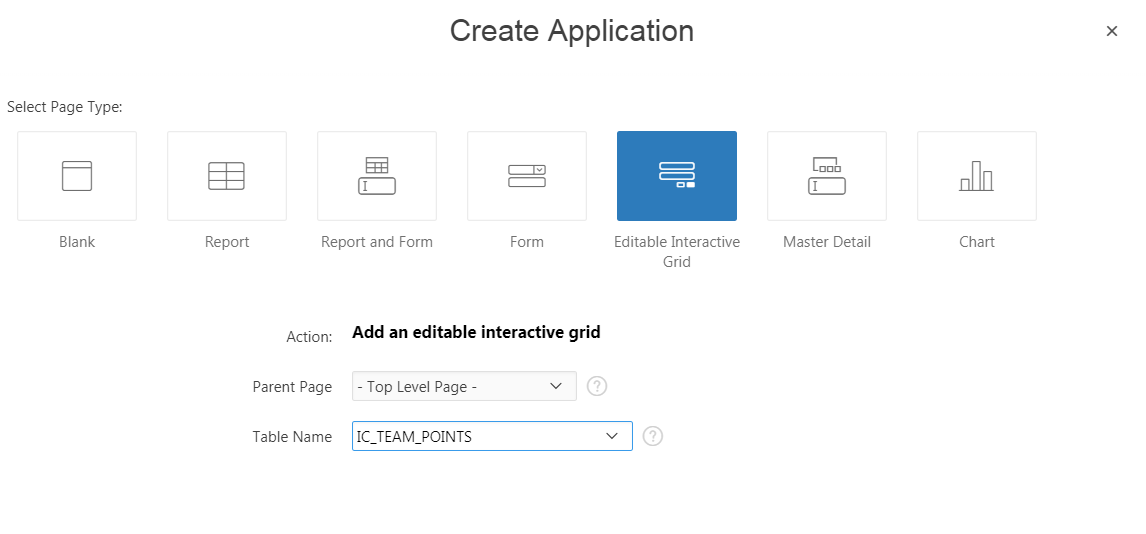
Step 3.2.3: Select Page Type → Editable Interactive Grid. Parent Page → Home(1), Page Source → Table, for Table Name → EMPLOYEES, and click the Add Page button followed by Next
Image may be NSFW. Clik here to view.
Image may be NSFW. Clik here to view.
Step 3.2.4: Accept the default, and click Next
Step 3.2.5: Accept the default, and click Next
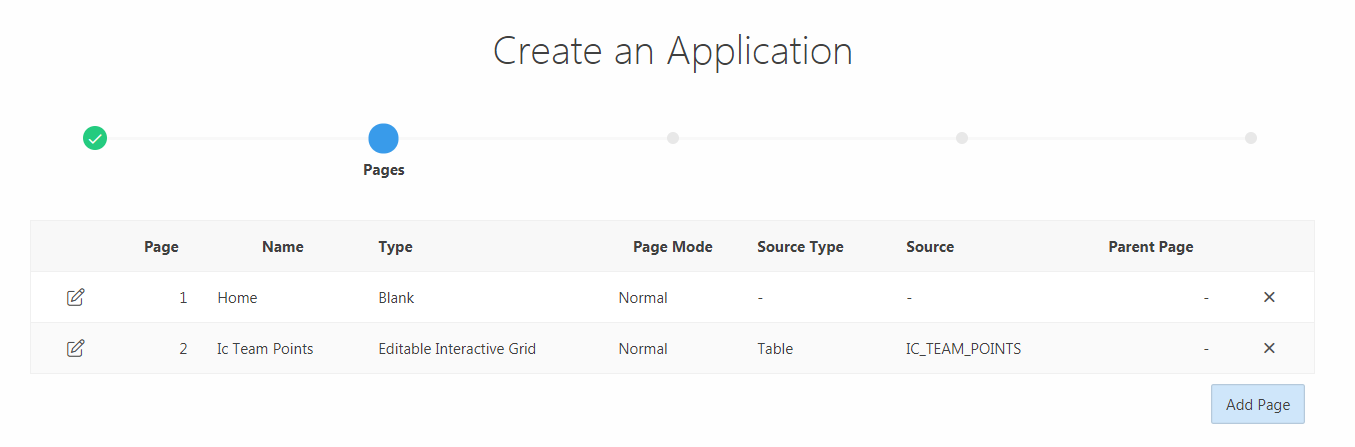
Step 3.2.6: Review the Summary Page and click Create Application
Step 3.2.7: click Run Application
Image may be NSFW. Clik here to view.
Step 4: On the Log On screen, enter your Apex credentials and click Log In.
Step 5: As the Home page application is displayed, you should be able to see the list containing employee records is displayed.
Step 6: On the Text Field of the Action Menu, you can search for values in the IG. Enter King in the search bar, and click Go.
Image may be NSFW. Clik here to view.
Step 7: On result you would notice that only rows containing employees with First Name or Last Name as King is displayed on screen. This also creates an filter was just above the Interactive Grid data.
Step 8: To resize a column, you can click and hold the edge of a column heading and adjust it with the mouse. In this case, place your mouse at the edge of the Phone Number column and adjust the mouse to display the complete column heading
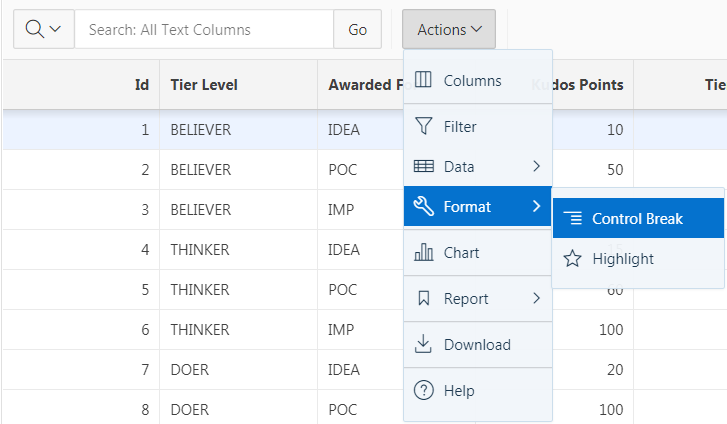
Step 9: Go ahead and create a control break on a column, for that select the Actions menu, select Format, and then select Control Break. Select column Job Id and click Save.
The control break is created. Notice the Job Id column is eliminated from the grid and now appears before each break point in the grid.
Image may be NSFW. Clik here to view.
Step 10: To hide a column, you can select the column header and then click the Hide icon. In this case, click the Phone header, and select the Phone icon. Now you notice that the Phone column is no longer displayed in the grid. To view the column in the grid again, use the Columns option from the Actions menu
Image may be NSFW. Clik here to view.
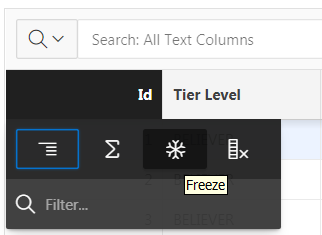
Step 11; To freeze a column, you can select the column header link and click the Freeze icon. Freezing a column excludes it from the scrollable area. Select the Email column heading and click Freeze
Scroll the page to your right, you see that the Email column is excluded from the scrollable area. Scroll back
Image may be NSFW. Clik here to view.
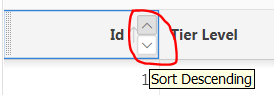
Step 12: To sort on a column, hover the mouse in the column heading you want to sort on and select the Sort Ascending or Sort Descending icon. Select the Last Name
column and select the Sort Ascending icon. The grid is now sorted on Last Name
Image may be NSFW. Clik here to view.
Step 13: You can remove a filter by selecting the Remove Filter icon next the to filter or deselect a filter by unchecking the check box next to the filter. In this case, click the Remove Filter icon next to the filter
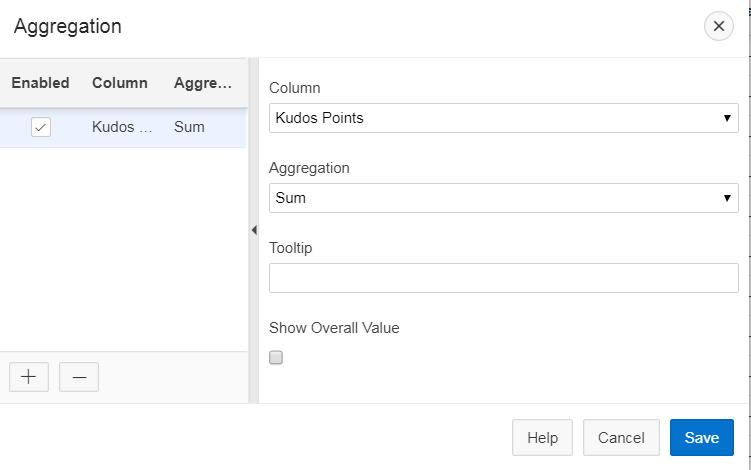
Step 14: To total the Salary, click the Salary header, and select the Aggregate icon. In the pop-up dialogue box, ensure that Salary is selected for Column, select Sum for Aggregation, and click Save
The grid displays total salary for each Job Id.
Image may be NSFW. Clik here to view.
Step 15: To reorder columns, select the column you want to move, place your mouse pointer at the start of the column header, and drag the column to the desired location. Move the First Name column after Email
You see the First Name column is moved next to Email. Click the Reset button to revert all the changes you made to the grid
You see all the changes made to the grid is rolled back.
I hope most of you must have heard a lot about the newsfeed user experience introduced in Release 13 Update 18B (further enhancements expected in update 18C and 19A) and I must say that as an end user one is bound to be in love with the new look.
A lot of unnecessary cluttering has been removed and only releveant information is presented for an end user to take action.
In this example we will demonstrate “How to Create a New Employee” and how does the associated screens look like. So let’s get started.
Assuming that one has created and enabled the pre-requisite profile options to enable Newsfeed feature one would land at below page once he/she logs in (Luckily am using a Cloud Demo Enviornment and all the setups are in place already) :
Image may be NSFW. Clik here to view.
Next, we will click on “Hire an Employee” link and the below screen opens up (We would see that the new screen will have all mandatory fields prefixed by an ‘*’ and also the hire date will be prepopulated with the current system date)
Image may be NSFW. Clik here to view.
Once we populate the fields and click on “Continue” it would take us to the next screen where we have to choose which of the associated areas are we interested to populate (for this exmple we would select “Add Manager Info”, “Add Salary” and “Add Compensation”)
Image may be NSFW. Clik here to view.
Once we click on Continue we can see following screen (where we need to populate details and submit)
Image may be NSFW. Clik here to view.
Now the important point here is that only one of the many sections displayed opens up at a particular time. Once an individual completes populating all fields of a specific section they can click on continue and the cursor moves to the next section. Post all the sections are entered ne can click submit and the transaction goes to next stage (completion stage in this example)
After we submit we can search for employee (using “Person Management’)
Navigation is : My Client Groups ->Person Management - Search for Person (Albert Thomas)
As a pre-requisite we would need to have a existing employee record which we would like to use. We would use “Jospeh Carlson” (Person# 10010) for this example.
Image may be NSFW. Clik here to view.
Next we need to click on the “Home” icon which will bring us to the following screen
Image may be NSFW. Clik here to view.
Next we need to click on “Change Legal Employer” and search for “Joseph Carlson” (remember you need to give the exact name and in same sequence..if you give the last name first and then the first name then search wont yield any results)
Image may be NSFW. Clik here to view.
Once you click on the employee name a new page will open whee one would be asked for the areas where all we would like to make change (for this example we will choose “Edit Manager Info” and “Edit Salary Info” sections along with the Legal Employer Change )
Image may be NSFW. Clik here to view.
We will change the Legal Employer from “US1 Legal Employer” to “UK Legal Employer” effective 01-Sep-2018
Image may be NSFW. Clik here to view.
Once all the sections are populated we can see the “Edit” (Pencil Icon) beside each section and then we can click on submit button.
Image may be NSFW. Clik here to view.
We can click on “Submit” Button (Top Right Hand Section) and once done we would be back to the Home Screen.
Image may be NSFW. Clik here to view.
Now we will Navigate to “Person Management” and search for Joseph Carlson
Image may be NSFW. Clik here to view.
We could clearly see that Global Transfer took place effective 01-Sep-2018
Elements are a major building block in the payroll modules but they can be used for Global HR , Absences and other modules too. Many a times “Information” type Elements can also be used as a placeholder to hold values . A common use case is during Data Migration where in we have employee related specific information stored in custom tables ( legacy systems like EBS, peoplesoft) and we want to hold the same information in Oracle HCM Cloud. Since, one cannot create custom database objects in a SaaS environment one can choose either creating a DFF (Descriptive Flex Field) or Information Type Element. Each of this approach has its own set of advantages and disadvantages and we would not be discussing about those here but will try to find out how we can use Information Type Element for the purpose (if one chooses to use that option).
While in some cases the Element Input Value could be a free field text at some times there is a need to restrict the allowed values to a specific set. One can achieve this by creating a Independent Value Set . But unfortunately there is a BUG in Application where in only Table Type Value Sets can be associated with an Element Entry Input Value. Details about the same can be found from the Metalink Note here.
There is an ER (Enhancement Request) Logged too for the same where in request has been made to allow different types of value sets (Format,Independent, Dependent, Shared...etc).
For now only a Table Type Value set can be associated with the Element Input Value. But there is one workaround using which one may create a Table Type Value Set from an Independent Value Set thereby allowing usage of later for assigning value to Element Input.
Creating a Table Type Value Set from an Independent Value Set
where ffv.flex_value_set_id = ffvs.flex_value_set_id
and ffvs.flex_value_set_name = 'RECORDS_TO_SHOW'
and ffv.enabled_flag = 'Y'
and TRUNC(SYSDATE) BETWEEN NVL(ffv.start_date_active,SYSDATE) and NVL(ffv.end_date_active,SYSDATE+1)
Create Value Set: Attribute Details
Attribute Name
Attribute Value
Value Set Code
XX_TEST_TABLE_VS
Description
Custom Table Type Value Set Creation From an Independent Value Set
Module
Global Human Resources
Validation Type
Table
Value Data Type
Character
From Clause
fnd_flex_value_sets ffvs,fnd_flex_values ffv
Value Column Name
ffv.flex_value
Value Column Type
VARCHAR2
Value Column Length
150
ID Column Name
ffv.flex_value
ID Column Type
VARCHAR2
ID Column Length
150
Where Clause
ffv.flex_value_set_id = ffvs.flex_value_set_id
and ffvs.flex_value_set_name = 'RECORDS_TO_SHOW'
and ffv.enabled_flag = 'Y'
and TRUNC(SYSDATE) BETWEEN NVL(ffv.start_date_active,SYSDATE) and NVL(ffv.end_date_active,SYSDATE+1)
Image may be NSFW. Clik here to view.
Creating Element and Associating Value Set with Input Value
For this example, we will create an Information Element (Employee Information) and attach the newly created value set XX_TEST_TABLE_VS. We will create a Input Value (Records to Show) and associate the Value Set with it.
Image may be NSFW. Clik here to view.
Verifying Results
As a last step we will add “Employee Information” Element to an Employee Record and verify whether the values stored in XX_TEST_TABLE_VS Table Type Value Set appears on the Records to Show Input Value.
I hope most of you are aware of what is meant by a Lookup in context of Oracle HCM Cloud Application but even if you are not we have got you covered. Hopefully this article (Understanding Lookups In Oracle Fusion Applications ) would give you a basic idea of the same.
One of the major feature of a lookup is that it only allows one unique lookup code and meaning.
What this means is that there can only be one unique value of lookup code can be present in lookup and similarly only one unique lookup meaning can exist.
Image may be NSFW. Clik here to view.
We can clearly see that if we use either the same lookup code say (‘A-B-C’) or same meaning (‘Y’) for one lookup-type (XX_DEMO_LKP) it throws an error stating:
Lookup Type XX_DEMO_LKP already has code A-B-C (FND - 7102)
Lookup Type XX_DEMO_LKP already has lookup code meaning Y (FND - 7103)
However, there are many a times when one may wish to have same meaning value. We all know that one may use lookup as a placeholder and in some cases one may wish to hold a specific data combination as eligible (say Y) and others as in-eligible (say N).
Imaging the following data combination
Data Combination
Eligibility (Y / N)
A-B-C
Y
D-E-F
N
G-H-I
Y
J-K-L
N
In such cases one may decide to create a independent value set and that would work fine too but lets say for now we would like to have these values stored in a lookup. Now , if we try to create a lookup by using the Data Combination and Eligibility values as Lookup Code and Meaning we would not be able to do so as the meaning cannot be repeated. But there does exists a workaround for the same.
Storing Non-Unique Values in Lookups
The trick here is to make use of “Description” column which does not has any such limitation. The side-effect of using this appraoch could be that one may not be able to use delivered Lookup Functions to get the lookup description value as they have been designed to fetch the lookup meaning when lookup type and code are passed as input, but the advantages are far more rewarding ( for a custom lookup) and one may always use a custom sql (in reports) to fetch the lookup description value ( we will have a look at the custom sql too).
For now lets try to see how can we store non-unique values in a lookup type.
Storing Non-Unique Values in Custom Lookup (XX_DEMO_LKP)
Lookup Code
Meaning
Description
A-B-C
A-B-C
Y
D-E-F
D-E-F
N
G-H-I
G-H-I
Y
J-K-L
J-K-L
N
These values when entered into the application would appear as below:
Image may be NSFW. Clik here to view.
We can clearly see that we can use the same value in description and no error is thrown.
The SQL Code to fetch the description is given below for handy reference.
and TRUNC(SYSDATE) BETWEEN NVL(fcl.start_date_active, SYSDATE) AND NVL(fcl.end_date_active, SYSDATE+1)
And when we run the same we can find the results as below:
Image may be NSFW. Clik here to view.
So this is how we can store non-unique values in a Custom Lookup In Oracle HCM Cloud Application. These concepts would apply for an On-premise enviornment too.
And with this I have come to the end of the article.
I hope this was a good read and would be helpful to you guys.
In one of the previous article we have seen how to Create dependent parameters for a BI Publisher Report in Oracle Fusion HCM Cloud Application. However, in that example we only created parameters which used values already present in database tables (seeded database fields) , but many times we would need to use custom values to achieve the same. Simply speaking imagine a requirement where we have two attributes say Category and Products. In each category we can have different products. Now imagine we are asked to create a report which will be having two parameters namely:
Category
This is an independent parameter which would list all available categories. Sample values being Furniture, Electronics, Sports, Clothing..etc.
Products
This is a dependent parameter which would list all product list. The list will vary based on the category chosen
The business requirement is to create a Report which would display the user-input values as chosen by the user. One prime feature the Report should have is that the Values displayed in the dependent parameters should vary based on the selection of the independent parameter.
So, let’s get started.
Creating Sample Data
As a starting point we first need to have a sample data created which will give details of the various categories and associated products with the category. For this example, we would use the following data set.
Category
Products
Furniture
Tables
Chairs
Bed
Book-Shelf
Cupboards
Electronics
TV
Laptops
Smartphones
Refrigerator
Washing Machines
Sports
Shoes
Track Pants
Water Bottles
Exercise Bands
Waist Trimmers
Clothing
Jackets
Jeans
T-Shirts
Waist Coats
Sweat Shirts
Creating Dependent and Independent Value Set
We would need to create two different Value Sets namely (XX_CATEGORY_INDEPENDENT_VS) and (XX_PRODUCTS_DEPENDENT_VS) .
Image may be NSFW. Clik here to view.
And for the dependent value set the screen shot would appear as below:
Image may be NSFW. Clik here to view.
Creating List of Values and Associating them with BI Report Parameter
Once the value sets are created one would need to create two List of Values (LOVs) and attach them with the report parameter.
We would create two LOVs namely CategoryLOV and ProductsLOV
SQL Query for CategoryLOV
select ffv.flex_value
from fnd_flex_value_sets ffvs,fnd_flex_values ffv
where ffv.flex_value_set_id = ffvs.flex_value_set_id
and ffvs.flex_value_set_name = 'XX_CATEGORY_INDEPENDENT_VS'
and ffv.enabled_flag = 'Y'
and TRUNC(SYSDATE) BETWEEN NVL(ffv.start_date_active,SYSDATE) and NVL(ffv.end_date_active,SYSDATE+1)
Image may be NSFW. Clik here to view.
Once the List of Values is created we need to associate it with Category parameter
Image may be NSFW. Clik here to view.
Note: We would need to ‘Check’ the ‘Refresh other parameters on change’ as this is the primary parameter value basis which dependent parameter value would change.
As, we have created LOV for Category parameter we would need to create a LOV for Product parameter too.
SQL Query for ProductLOV
select ffv.flex_value
from fnd_flex_value_sets ffvs,fnd_flex_values ffv
where ffv.flex_value_set_id = ffvs.flex_value_set_id
and ffvs.flex_value_set_name = 'XX_PRODUCTS_DEPENDENT_VS'
and ffv.enabled_flag = 'Y'
and TRUNC(SYSDATE) BETWEEN NVL(ffv.start_date_active,SYSDATE) and NVL(ffv.end_date_active,SYSDATE+1)
and ffv.parent_flex_value_low = :Category
Image may be NSFW. Clik here to view.
And once we associate the parameter with LOV the screen would appear as below:
Image may be NSFW. Clik here to view.
Creating BI Report and Verifying Results
Now that we have created the parameters and attached LOVs to them we can create the Data Model and also create a Report (We would use a RTF Template for this example)
Data Model Query
select :category category,:products products from dual
Image may be NSFW. Clik here to view.
The RTF Template attached to the BIP Report would look as below:
Image may be NSFW. Clik here to view.
And now when we run the report we can see the following
Value for Category Parameter
Values displayed for Products Parameter
Clothing
Image may be NSFW. Clik here to view.
Electronics
Image may be NSFW. Clik here to view.
Furniture
Image may be NSFW. Clik here to view.
Sports
Image may be NSFW. Clik here to view.
And when we run the report we can get the output as shown:
Image may be NSFW. Clik here to view.
Summary
So, this is how one can dynamically change value of a dependent parameter based on the value of independent parameter.
One important point to note here is that while we have used a combination of independent and dependent value set to achieve this functionality the same functionality can be achieved by using SQL along with UNION clause but this (value set) approach has certain benefits over the union based approach like:
Reusability
Since we are using value sets which are integral part of application the same can be reused across the application. Data redundancy is reduced and we ensure that there is a single source of truth. We make changes in value set values and it gets reflected across all places where the same is used.
Ease of Use and Maintenance
One would not be required to change the underlying SQL attached to the List of Values. One can add/remove/edit the value set values and this gets reflected in the report.
No Technical Expertise Required
Once the report development is complete business users and functional consultants can make changes to value set from UI and run the report. There won’t be any need to change the report definition.
Most of us must have created multiple BIP Reports where we display data in Tabular format. However, there are some scenarios there are some specific kind of reports like headcount reports, revenue reports , sales reports, forecast reports etc. which are best viewed making use of charts (bar graph, horizontal graph, pie charts).One can easily embed such charts and graphs in OTBI Analysis by adding different views to the Compound Layout but what if we want to have the same featured in BI Report which has SQL as the data source. One can achieve this by creating a custom template.
In this example, we will demonstrate this.
We can broadly classify the entire process into two categories:
Create Data Model based on SQL query
Create Layout Template
Create Data Model
We would use a query which will fetch the count of workers (Employee Count, Contingent Worker Count and Total Headcount)
AND TRUNC(SYSDATE) BETWEEN ppos.date_start AND NVL(ppos.actual_termination_date,TO_DATE('12/31/4712','MM/DD/YYYY'))
AND primary_flag = 'Y') period_of_service_id -- Primary flag is Y to indicate the primary work relationship for that legal employer within that period. This flag is set to Y when worker has moved beyond Pending Worker. Within the legal entity only one relationship can be primary
FROM per_all_people_f papf
WHERE 1 = 1
) TablePerson,
PER_ALL_ASSIGNMENTS_M paam
WHERE 1 =1
AND paam.period_of_service_id = TablePerson.period_of_service_id
AND TRUNC(SYSDATE) BETWEEN paam.effective_start_date AND paam.effective_end_date -- Include only Employee and Contingent Worker
AND paam.system_person_type IN ('EMP','CWK') --Get Only Active and Suspended records
AND paam.ASSIGNMENT_STATUS_TYPE IN ('ACTIVE','SUSPENDED')
AND paam.primary_assignment_flag = 'Y'
AND paam.effective_latest_change = 'Y'
GROUP BY paam.LEGISLATION_CODE
ORDER BY 4 desc
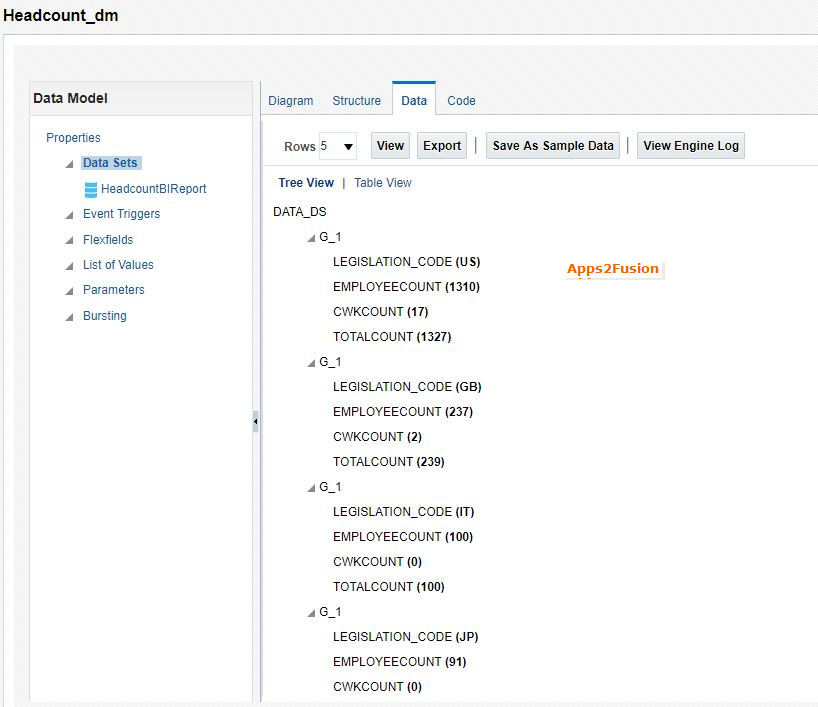
The Data Model when created will have sample data as below:
Image may be NSFW. Clik here to view.
Create Layout Template
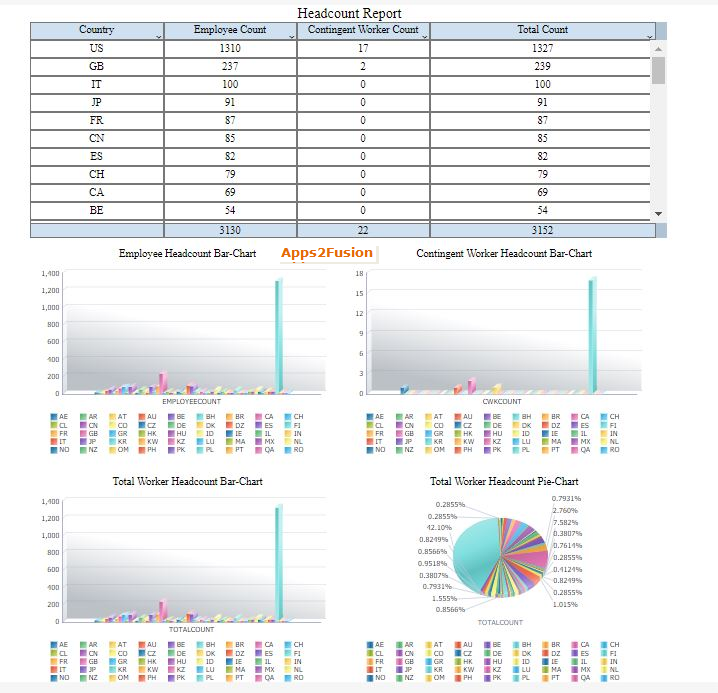
We will create a custom template which will contain:
Data Table
Bar Chart Showing Legislation Wise Employee Count
Bar Chart Showing Legislation Wise Contingent Worker Count
Bar Chart Showing Legislation Wise Total (Employee + Contingent Worker) Count
Pie Chart Showing Legislation Wise Total Worker Distribution
The template would appear as below
Image may be NSFW. Clik here to view.
And when we run the report we can see the report output
User Specific Dashboard (Only one user should be able to run this dashboard from the springboard icon and others should not)
Feasibility of returning to homepage from the Dashboard
We can categorize the entire activity into following sub steps:
Creating OTBI Analysis
Embedding OTBI Analysis into a Dashboard
Embed a Link or Image which when clicked navigates to homepage
Creating a Custom Page and Category
Add EL Expression to ensure that only for specific users (say all except HCM_IMPL2 for example)
So lets, get started.
Creating OTBI Analysis
We will create a custom OTBI Analysis based on subject area “Workforce Management – Worker Assignment Real Time”, we will try to fetch Legislation Code, Assignment Type and Assignment Count.
Field Name / Label
Data Source
Legislation
"Legal Employer"."Legislation"
Assignment Count
"Worker Assignment"."Assignment Count"
Assignment Type
"Worker"."Assignment Type"
Image may be NSFW. Clik here to view.
Embedding Analysis and Homepage Link Into Dashboard
As a next step we would need to create a dashboard and add the analysis to the dashboard. Also, we would add the Home page link.
Image may be NSFW. Clik here to view.
Creating Custom Page and Category
Next, we will need to create a sandbox and create a new category and new page. (Check this article to find out how to add new category and page in Oracle Fusion HCM Cloud Application)
We will populate the details and create a new group named “Custom Category”. We will also use an EL Expression such that the group will appear for all users except for “HCM_IMPL2”
Image may be NSFW. Clik here to view.
Similarly, we will also create a custom page titled “Headcount Dashboard”. This page will be inside the Custom Dashboards group and this will also have an EL expression.
Image may be NSFW. Clik here to view.
Once done we can publish the sandbox and proceed with verification step.
Verification
Now, that we have published the sandbox lets proceed to check in the navigator and springboard whether the new category and page are visible.
“Custom Dashboard” category newly created is not visible on Navigator (this is in-line with our setup as we have explicitly mentioned that the category should not be visible to HCM_IMPL2 user)
Image may be NSFW. Clik here to view.
Also, we could not find “Headcount Dashboard” page entry on springboard icon and this is also because of the same EL expression criteria we have used.
Image may be NSFW. Clik here to view.
We would now login as a different user (say “ROBERT.JACKMAN” ) and check whether the new category and page are visible.
The moment we login to application with ROBERT.JACKMAN we could see the springboard icons and “Headcount Dashboard” is visible
Image may be NSFW. Clik here to view.
Also, we would be able to see “Headcount Dashboard” under “Custom Dashboards” category in the Navigator
Image may be NSFW. Clik here to view.
And now as a last step one can click on the links (either from springboard icon or the navigator menu item) and verify whether the link takes them to the dashboard.
Image may be NSFW. Clik here to view.
And when one clicks on the Home icon or the text “Return to Homepage” one would be redirected to the homepage.
In this post, we would try to demonstrate how to achieve the same.
So, lets get started.
Creating Parameters for the Data Model
We would create three parameters namely p_day, p_month and p_year.
The details of the parameter will be as in the below tables
p_day
Attribute Name
Attribute Value
*Name
p_day
Data Type
Date
Default Value
{$SYSDATE()$}
Parameter Type
Date
Display Label
Enter Day ( Values between 1 - 31)
Text Field Size
2
Options (Ignore User Timezone)
Checked
Date Format String
dd
Image may be NSFW. Clik here to view.
p_month
Attribute Name
Attribute Value
*Name
p_month
Data Type
Date
Default Value
{$SYSDATE()$}
Parameter Type
Date
Display Label
Enter Month (Values between 1 - 12 )
Text Field Size
2
Options (Ignore User Timezone)
Checked
Date Format String
MM
Image may be NSFW. Clik here to view.
p_year
Attribute Name
Attribute Value
*Name
p_month
Data Type
Date
Default Value
{$SYSDATE()$}
Parameter Type
Date
Display Label
Enter Year (YYYY Format)
Text Field Size
4
Options (Ignore User Timezone)
Checked
Date Format String
yyyy
Image may be NSFW. Clik here to view.
Also, we have a very simple SQL defined in the data set which is as follows
SQL Query
select :p_day day,
:p_month month,
:p_year year
from dual
Now we will navigate to the “View Data” tab and check the default values fetched in the parameters and also the value returned when we run the data model.
Image may be NSFW. Clik here to view.
So, in order to resolve this problem, we would try to change the Parameter Type from “Date” to “String” and see the results.
Image may be NSFW. Clik here to view.
And once we see the results we could see the desired results
Summary
So this is how we can have default day, month and year values as parameter default. There are two tricks involved in achieving this requirement. They are:
Using {$SYSDATE()} as default value with Date as Parameter Data-Type and changing the
Date Format String Values to ‘dd’ , ‘MM’ and ‘yyyy’ respectively for Day , Month and Year parameters.
Changing the Data Type and Parameter Type values back to ‘String’ and ‘Text’ respectively.
At this point, one may argue that why to first define a parameter as Date Type and then change it to Text type and why not directly create a text type parameter with default value as {$SYSDATE()$} . The reason for this is that when we define a Date Type parameter we get options to choose the Date Format Options which isn’t available for a Text Parameter. So if we choose a Text Parameter the default value would appear as {$SYSDATE()$} instead of actual values.
One may try using the Text Parameter Type and he/she would encounter the same issue. So this is why we need to first choose the parameter type as a Date Type Parameter , assign Date Format Options and then change the Data Type and Parameter Type values.
How to use the Operator Navigator to monitor the execution of an interface.
Through Operator Navigator, you can see the session that was created to run the interface,
and see how the interface is broken down into smaller steps. The details of how ODI executes
your interface are now revealed
Operator Navigator: Viewing the Log
Image may be NSFW. Clik here to view.
In the Operator Navigator, you may have different sessions available for examination. To help
find the one you want, sessions are sorted in different ways in the tree view: by the date of
execution, the physical agent used, the name of the session (sessions), the current state of
execution, or by keywords.
Alternatively, you can see all executions together. Different Operator views show the same information in slightly different formats.On the toolbar, you can launch other ODI modules (Designer, Topology, and so on). You can manually refresh the session list or set it to automatic refresh. To remove all stored sessions,you can purge the log, and you can also see the schedule. Navigation buttons such as Back
and Forward are helpful for quickly comparing two similar execution logs.
The property window shows you the properties of any object in the Session List. Double clicking an item opens its property window.
Using Operator Navigator
Operator Navigator serves primarily to show the execution log of the interfaces that you launched.
Whenever you execute an interface, you create a session. You must, therefore, find thesession in Operator Navigator that corresponds to the time you launched your interface.In Operator Navigator, you can stop, edit, and restart sessions. This flexibility enables you to fix a problem in a session and continue without having to relaunch the interface from Designer.
Sessions, Step, Tasks: The Hierarchy
Image may be NSFW. Clik here to view.
Every time an interface is executed, a session is created. However, a session can actually execute several interfaces in sequence (known as a package). Thus in a session, an interface corresponds to just one step. However, moving data around to execute an interface is a complicated process. This process is made up of tasks. A task may consist of retrieving data from a table, writing to a file, creating a temporary table, or cleaning up. The series of tasks is determined entirely by the knowledge modules that you have chosen.
Each task has one state at any given moment: Running, Waiting, Done, Error, or Warning.There can also be, at most, only one task in Running state in a given session at any given moment. The states of the tasks in a step then determine the state of the step: If all tasks are Done, the step is Done. A task can be completed with constraint errors. If a task has an Error,that step is in the Error state, and so on. Similarly, the states of the steps determine the state of the session as a whole.
You can see the details of a session, step, or task by double-clicking it.
Viewing Details of Sessions, Steps, and Tasks
When you double-click a session step, you see its details. You can see and change the session state on the Execution tab. You can put the session into the Waiting state to make it run when you restart the session. You can also see any relevant error messages and the number of rows processed so far.
When you double-click a session task, you see a similar window. On the Description tab, you
can see the actual code executed. This is very useful for diagnosing advanced problems.
Image may be NSFW. Clik here to view.
How to Troubleshoot a Session
The general process is as follows:
1. Finding the error is usually straightforward. You open Operator Navigator, find thesession in error, the step in state Error, and finally the task in error.
2. Then you look at the code generated by ODI. To do this, double-click the task and click the Description tab. The code is usually in SQL and is dependent on the knowledge modules used by the interface.
3. Fixing the generated code often takes the most time. You must have a solid understanding of how ODI works and how the relevant technologies work. You can enter directly into the code box to make the changes. Click the Apply or OK button when finished. Then, right-click the session and select Restart. Refresh the Session List to check if your error has been resolved. If it has not been refreshed, you can keep making further changes and restarting the session.
When you have fixed the error in the generated code, you should update the interface to take the change into account. Otherwise, the next time you execute the interface, the oldcode with the error is generated again.
Image may be NSFW. Clik here to view.
Benefits of Monitoring ODI monitoring can do the following: •Sometimes detect underlying problems before they have an adverse effect •Detect problems that affect a user's productivity •Collect data when a problem occurs for the first time •Find the execution log of the interfaces that you launched •Find the status of each task at any given moment: Running, Waiting, Done, Error, or Warning •Allows to drill into the Error or the number of rows processed
One of the major challenges consultants have faced over the last couple of years with respect to HCM Data Load is to automate the entire process of Downloading Data from the HCM Cloud Application, Making Transformation (Updates/Edits to them) and reloading the same back to the application using HCM Data Loader.
Things are relatively easy if one is loading data from a legacy application to HCM Cloud as in most cases one has access to database where they can use pl/sql programs to first get data in HDL format and then use transformation technique to make changes to data and then upload the HDL file in Oracle HCM Cloud Application.
Imagine, you are asked to do the entire activity in HCM Cloud itself. Meaning say your application is already gone live and then there is a requirement to say change the location of all employees in the system from Location A to Location B . One would need to create a new assignment record which would start one day after the most recent assignment record. In this scenario one would have to perform the following steps:
Extract All Eligible Records in HDL format
Make Changes to the record
Upload the new record into application
In this, example we would try to demonstrate the same. For simplicity sake we would only use one Worker Record (Person#898453 for this example) and just modify the value of one attribute say “WorkAtHomeFlag”. Which means if the value of “Work from Home” is No or Null the new record should have a value of Yes and if the value of Work from Home is Yes it should be changed to No.
So, we will create an HCM Extract which will fetch the following fields:
Business Object / Entity
Data Field
WorkRelationship
PeriodOfServiceId
PersonId
LegalEntityId
DateStart
PrimaryFlag
WorkerNumber
WorkerType
Business Object / Entity
Data Field
WorkTerms
AssignmentId
PeriodOfServiceId
EffectiveStartDate
EffectiveEndDate
EffectiveSequence
EffectiveLatestChange
AssignmentName
AssignmentNumber
ReasonCode
WorkAtHomeFlag
*Field Highlighted in Green is the one which is to be changed. All other fields are basic fields which are required for any update/correction action required.
Business Object / Entity
Data Field
Assignment
AssignmentId
WorkTermsAssignmentId
EffectiveStartDate
EffectiveEndDate
EffectiveSequence
EffectiveLatestChange
AssignmentName
AssignmentNumber
PrimaryAssignmentFlag
PrimaryFlag
ReasonCode
WorkAtHomeFlag
*Field Highlighted in Green is the one which is to be changed. All other fields are basic fields which are required for any update/correction action required.
We would have two data groups created namely WorkerDataGroup and WorkTermsDataGroup. WorkerDataGroup is the Root Data Group.
Image may be NSFW. Clik here to view.
Some Details related to Data Group are in table below:
DataGroupName
UserEntity
DataGroupFilterCriteria
ExtractRecords
WorkerDataGroup
PER_EXT_WORK_RELATIONSHIP_ALL_UE
(pps.person_id=300000173638388)
WorkRelationship
WorkTermsDataGroup
PER_EXT_SEC_ASSIGNMENT_UE
(asg.primary_flag='Y')
WorkTerms
Assignment
Also we should have the following Connection between the Root Data Group (WorkerDataGroup) and WorkTermsDataGroup
Parent Data Group
Parent Data Group Database Item
Child Data Group
Child Data Group Database Item
WorkerDataGroup
Extract Relationship Period Of Service Id
WorkTermsDataGroup
Extract Assignment Period of service
Once we have all these details populated we would need to define the Extract Delivery Options. Details for which are in below table
Now that we are all set from extracting the data from application. Let’s next try to focus on the transformation logic applied. We would apply the logic on the eText Template and the reason for the same is:
We do not want to use any transformation in HCM Extract
All Transformation are done in eText template
This, however is the approach I followed, and one may choose to have a different rule applied.
As discussed, we would be creating a new record and only try to modify the value of “WorkAtHomeFlag”. This eventually means that we will have the Effective Start Date value changed to current value + 1 for both WorkTerms and Assignment Record and the value of “WorkAtHomeFlag” altered based on current value (i.e from ‘N’ to ‘Y’ , ‘Y’ to ‘N’ or even Null to ‘Y’)
Business Object/Entity
Data Field
Transformation Logic
WorkTerms
EffectiveStartDate
INCREASE_DATE(EffectiveStartDate,1)
WorkTerms
WorkAtHomeFlag
If WorkAtHomeFlag = ‘N’ or WorkAtHomeFlag is NULL
Then ‘Y’
Else If WorkAtHomeFlag = ‘Y’
Then ‘N’
End If
Assignment
EffectiveStartDate
INCREASE_DATE(EffectiveStartDate,1)
Assignment
WorkAtHomeFlag
If WorkAtHomeFlag = ‘N’ or WorkAtHomeFlag is NULL
Then ‘Y’
Else If WorkAtHomeFlag = ‘Y’
Then ‘N’
End If
Upload the New Record into Application
Once we are done with the above setup we will get Worker.txt file which will have all the data but HDL only supports .dat file extension and so to ensure we get the file with same filename and also it triggers the “HCM Data Loader” we have to perform the following steps:
Add a parameter named “Auto Load” to the UpdateAssignmentExtract
Add “Initiate HCM Data Loader” to UpdateAssignmentExtract payroll flow
Add “Auto Load” Parameter to UpdateAssignmentExtract
We would need to add a new parameter. Details of the parameter are in below table
Attribute Name
Attribute Value
Sequence
100
Name
Auto Load
Tag Name
Auto_Load
Data Type
Text
Display
Yes
Image may be NSFW. Clik here to view.
Add Initiate HCM Data Loader Payroll Flow to UpdateAssignmentExtract Payroll Flow
As a next step we would also need to Add “Initiate HCM Data Loader” Payroll flow as part of UpdateAssignmentExtract Payroll Flow. We can either navigate to Payroll->Checklist->Search for UpdateAssignmentExtract Payroll Flow Pattern or use Refine Extracts->Search for UpdateAssignmentExtract
Once the search results are retrieved we need to click on “Edit” (pencil icon) and choose the following task
Name
Initiate HCM Data Loader
Description
Generate HCM Data Loader File and optionally perform a Data Load
Task Type
Standard Process
Image may be NSFW. Clik here to view.
*Please make sure to select the payroll flow which has the description of “Generate HCM Data Loader File and optionally perform a Data Load” as the other payroll flow task which has similar name will not serve the purpose here (both have different definition)
Once we add the payroll flow task we should click on “Go To Task” and add the following details:
Initiate HCM Data Loader Task Definition: Basic Information (Data Loader Archive Action)
Name
Data Loader Archive Action
Execution Mode
Submit
Data Type
Text
Parameter Basis
Bind to Flow Task
Basis Value
UpdateAssignmentExtract, Submit , Payroll Process
Usage
Input Parameter
Initiate HCM Data Loader Task Definition: Basic Information (Data Loader Configuration)
Name
Data Loader Configuration
Execution Mode
Submit
Data Type
Text
Parameter Basis
Constant Bind
Basis Value
ImportMaximumErrors=100,
LoadMaximumErrors=100,
LoadConcurrentThreads=8,
LoadGroupSize=100
Usage
Input Parameter
Image may be NSFW. Clik here to view.
Now the setup part is complete.
Verification
In order to confirm that the automatic load process is working as expected we need to perform the following steps:
Verify Application Data Before Load
Run UpdateAssignmentExtract
Check the Worker.dat file which is zipped inside UpdateAssignment.zip
Verify Application Data After Load
Verify Application Data Before Load
We would navigate to Person Management -> Search for Person Number 898453 and check the Assignment Record.
Image may be NSFW. Clik here to view.
We could see that the most recent Assignment Record has Effective Start Date as 10/14/18 (i.e 2018/10/14 in YYYY/MM/DD format) and the value of Working at Home field is No
This means that the new Assignment Record should have an Effective Start Date of 10/15/18 (i.e 2018/10/15 in YYYY/MM/DD format) and the value of Working At Home should be Yes.
Run UpdateAssignmentExtract
We would now submit the UpdateAssignmentExtract with Auto Load parameter value as ‘Y’
Image may be NSFW. Clik here to view.
When we click on “Ok and View Checklist” it would take us to the checklist page where we can check the status of the tasks.
Image may be NSFW. Clik here to view.
We can see that the payroll task has successfully completed.
Also, when we check the extract run details for “SampleRun10” we can find that a content id has been generated (DL_WORKER_1416194)
Image may be NSFW. Clik here to view.
Check the Worker.dat file zipped inside UpdateAssignment.zip
Once we click on the Download icon next to DL_WORKER_1416494 , UpdateAssignment.zip file gets downloaded. The zip file contains Worker.dat file which has the HDL file as prepared by combination of UpdateAssignmentExtract and the UpdateWorkAtHomeFlag eText template. We could see that the transformation rule have been applied and so the effective start date is 2018/10/15 and also WorkAtHomeFlag value is ‘Y’
Image may be NSFW. Clik here to view.
Verify Application Data After Load
Before we look at the Assignment Detail for Person# 898453 let us have a look at the “Import and Load Data” screen
Image may be NSFW. Clik here to view.
And now if we quickly look at the Assignment Record for 898453 23 could see that a new assignment record has got created effective 10/15/2018 and also the Work From Home value has changed to Yes
Image may be NSFW. Clik here to view.
Summary
So, this is how one can automate the HCM data load in Oracle HCM Cloud Application. While I have only used a single attribute “WorkAtHomeFlag” to demonstrate how this feature works one can use any other attribute or a combination of attribute and update the same.
You may download the Extract Definition, eText RTF and the sample Worker.dat file from below link: